Risk Management
Credit Risk Management: How Lenders Measure, Monitor and Mitigate Risk
September 7, 2026 •
23 min read

As lending becomes more complex, financial institutions need effective ways to manage credit risk while balancing regulatory requirements with profitability and portfolio health. Knowing how to improve credit risk management means using reliable methods to assess borrowers, monitor exposure, and identify potential losses early, before deterioration reaches the charge-off line.
Spending on risk technology reflects that pressure. Precedence Research values the global credit risk assessment market at $10.90 billion in 2026 and projects $31.46 billion by 2034.
This guide covers the key elements of credit risk management: assessment methods, the metrics and formulas risk teams use day to day, the regulatory standards that shape them, and the practices that keep portfolios stable through a cycle.
Credit risk management is about managing the risk that a borrower will not repay a loan or meet their contractual obligations to the lender. For any lending provider, it determines how much of the portfolio turns into a loss and how much capital must be held against that loss. Sound credit default risk management is also a condition of meeting regulatory obligations.
Credit risk assessment usually starts with the five C’s—a qualitative framework, not a formula, though it still shapes most credit policies and decides which inputs later feed the models.
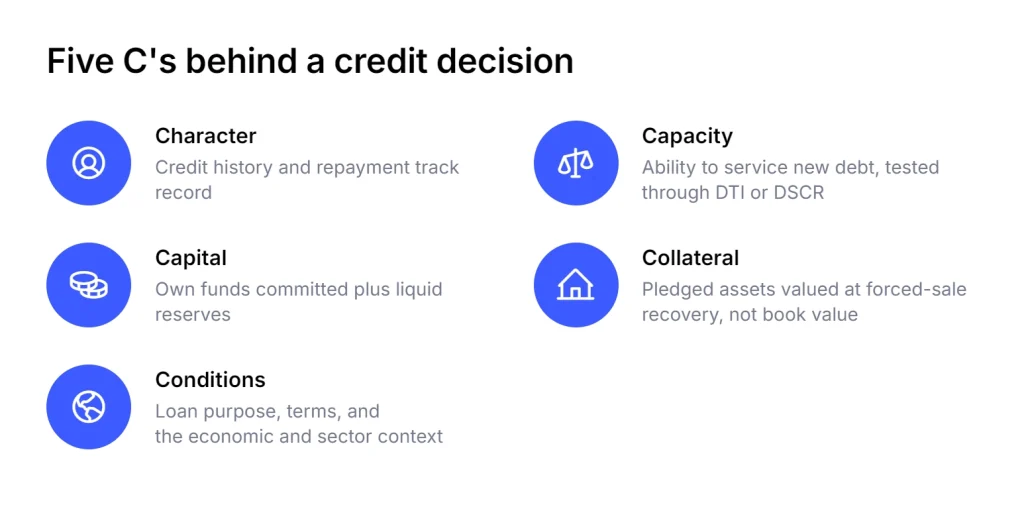
So, before looking at how to calculate credit risk numerically, here is what the five C’s cover:
Methods of measuring credit risk vary depending on the lender, the portfolio, and the regulatory regime. Almost all of them assume that historical repayment behavior, calibrated against current conditions, is the best available predictor of whether a borrower pays.
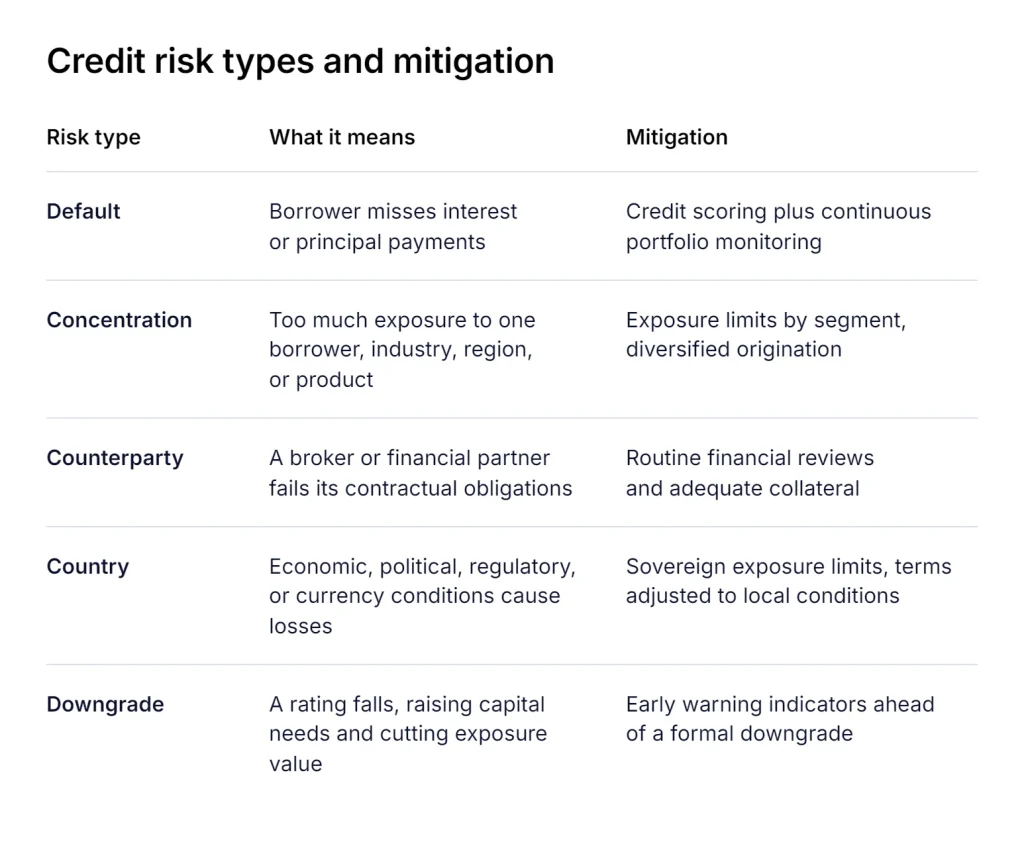
Lenders split credit exposure into categories because each one calls for a different control. Once exposure is split this way, the broad elements of credit risk management become specific limits, triggers, and review cycles.
What is it: this is the risk that a borrower fails to repay interest or principal or otherwise meet the agreed loan terms.
How to mitigate it: use historical repayment data, credit scoring, and continuous portfolio monitoring to identify signs of financial strain early.
What is it: this one occurs when a lender has excessive exposure to a single borrower, industry, geographic area, or loan product.
How to mitigate it: set exposure limits across sectors, asset classes, regions, and individual borrowers to maintain a diversified portfolio, and review those limits as the portfolio mix shifts rather than only at policy renewal.
What is it: counterparty risk is the risk that a financial partner, broker, or other counterparty fails to fulfill its contractual obligations.
How to mitigate it: conduct regular financial assessments of counterparties and require sufficient collateral where appropriate.
What is it: it refers to potential losses caused by economic, political, regulatory, or currency conditions in a particular country.
How to mitigate it: set sovereign exposure limits and adjust lending terms to reflect country-specific economic and geopolitical conditions.
What is it: this is the risk that a borrower’s credit rating deteriorates. A lower rating can raise capital requirements and reduce the value of related assets.
How to mitigate it: track borrower performance and early warning indicators to identify deteriorating credit quality before a formal downgrade.
Quantitative assessment rests on three parameters: probability of default, loss given default, and exposure at default. Multiplied together, they produce expected loss, the figure that drives loan pricing, provisioning, and capital planning.
The probability of default model, or PD model, estimates the likelihood that a borrower will default over a defined horizon, typically twelve months. Most lenders define default as 90 days past due or an unlikely-to-pay assessment, in line with supervisory practice. Risk teams determine this number by feeding credit bureau data, past payment habits, and current income into a calibrated credit risk model.
The percentage allows lenders to assign a risk tier more accurately, apply risk-based pricing, and keep overall default expectations in check. Pricing and provisioning use a point-in-time PD, which moves with the economic cycle. Capital planning uses a through-the-cycle PD that is deliberately smoothed. If the two are swapped, capital requirements start following the cycle and provisions lag behind it.
Lenders rarely lose the full balance when a borrower defaults because collateral or collection efforts recover part of the debt. The loss given default (LGD) measures the percentage of exposure that is permanently lost once pledged assets have been liquidated or recovery has been pursued.
An LGD estimate should count recoveries net of collection and legal costs and discount them back to the default date, since a dollar recovered after three years buys less than a dollar recovered after three months. Skip either step, and the estimate understates the loss.
Accurate LGD model calculations also stop lenders from overestimating recoveries in a market downturn. For the same reason, supervisors expect a separate downturn LGD on top of the long-run average.
Financial institutions calculate their baseline monetary risk by multiplying these three metrics together:
EL = PD × LGD × EAD
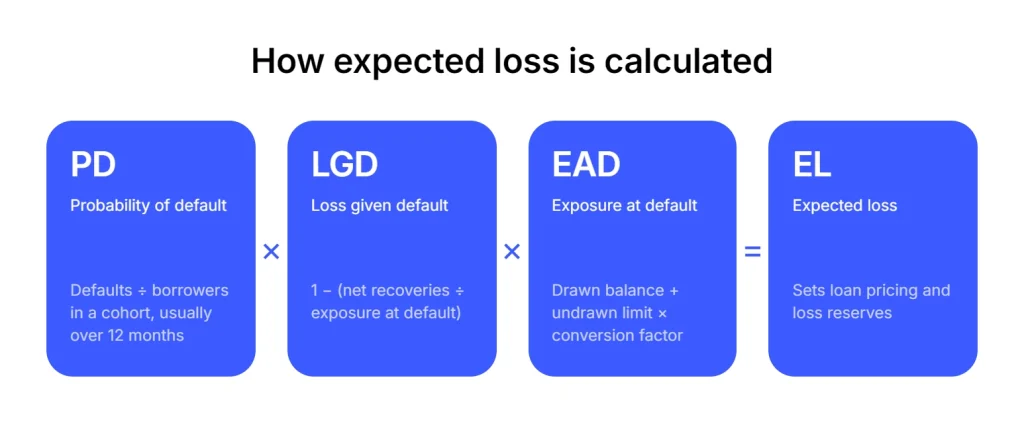
Exposure at default (EAD) is the base the other two parameters apply to: the amount outstanding at the moment a borrower stops paying. Risk managers use this figure to set firm, sensible credit limits on revolving products such as credit cards and overdraft facilities.
On a fully drawn amortizing term loan, EAD sits close to the outstanding balance and adds little. On revolving and committed-undrawn exposures, EAD depends on the credit conversion factor, the estimated share of the unused limit a borrower draws before default. That factor is easy to set once at a regulatory value and never revisit, so it needs periodic testing.
The expected loss calculation represents the standard cost of doing business in credit operations. Lenders use it to price products and set routine loss reserves. While expected losses cover predictable non-payment trends, unexpected losses account for severe market downturns where defaults exceed historical averages. Provisions cover expected loss, and capital absorbs unexpected loss. A loan priced against expected loss alone earns no return on the capital held behind it.
For credit risk measurement, risk managers rely on specific metrics to evaluate asset quality, track collection performance, and adjust underwriting thresholds as risk conditions change.
Let’s look at the key indicators used for credit risk analysis and how they are applied throughout the portfolio lifecycle.
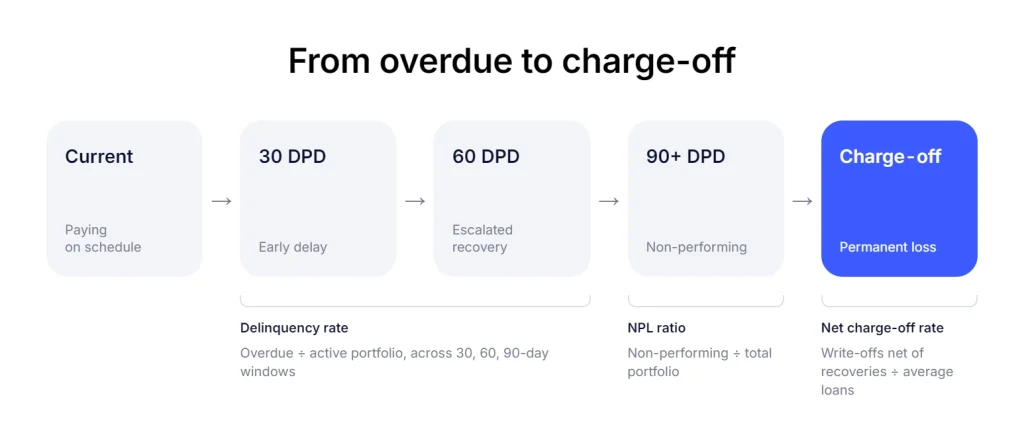
This metric measures the proportion of non-performing loans relative to the overall size of the portfolio. Lenders typically classify an asset as non-performing when scheduled payments remain past due for 90 days or longer, though most supervisory definitions also capture exposures judged unlikely to pay in full regardless of how many days have elapsed.
Why it matters: it serves as a primary benchmark for total portfolio risk and shows how much of the loan book is tied up in troubled assets.
The delinquency rate tracks the percentage of active loans with overdue payments within a given period. It captures early-stage payment delays across 30-day, 60-day, or 90-day windows.
Why it matters: rising delinquency rates act as an early warning system and flag repayment problems before accounts turn into hard losses. Count-based and balance-based versions of the ratio can diverge sharply, so any report should say which one it uses before anyone compares periods.
DPD counts the exact number of consecutive days a borrower has missed a scheduled payment deadline. System rules update this tally daily until the account holder clears the overdue balance.
Why it matters: it triggers collection workflows and helps operations teams bucket accounts by urgency for targeted intervention.
This percentage reflects total debt written off as uncollectible after accounting for any funds recovered through collections or collateral valuation. Lenders calculate it against the average total loans over a specific timeframe.
Why it matters: it reveals the actual net loss hitting the bottom line. Provisions are estimates, while charge-offs record losses that have already happened. Write-off timing is a policy choice, so the ratio only compares across lenders whose charge-off policies match.
Vintage analysis groups loans by their origination timeframe and tracks their default trajectories over time. Risk teams compare performance curves across quarterly or monthly loan cohorts, always at the same age and never at the same calendar date. Comparing by calendar date mixes young and seasoned loans, which makes newer vintages look healthier than they are.
Why it matters: it isolates whether changes in credit quality stem from broader economic shifts or recent changes in underwriting standards.
Roll rate measures the percentage of delinquent balances that transition from one DPD stage to a worse stage such as moving from 30 DPD to 60 DPD.
Why it matters: it shows how fast delinquent balances move toward default. Teams use it to evaluate collection performance and forecast upcoming charge-offs.
The credit risk management process is shaped by several regulatory and accounting standards that determine how lenders measure, provision for, and manage potential losses.
The key frameworks include:
The Basel Accords establish international standards for capital adequacy and risk management across the global banking sector, alongside the Committee’s Principles for the Management of Credit Risk, which set expectations for credit granting, administration, and measurement. The guidelines require financial institutions to hold minimum capital against risk-weighted assets, sized to their total portfolio risk exposure.
These capital buffers protect institutions from insolvency during unexpected market downturns and limit excessive balance sheet leverage. Basel standards take legal effect only through national and regional implementation. That is why capital treatment of the same exposure differs between the EU, the US, and the UK.
IFRS 9 and CECL standards. Modern accounting mandates require lenders to transition from incurred-loss models to forward-looking expected credit loss estimation over a loan’s lifetime. Global entities follow IFRS 9, whereas US financial institutions adhere to the CECL framework.
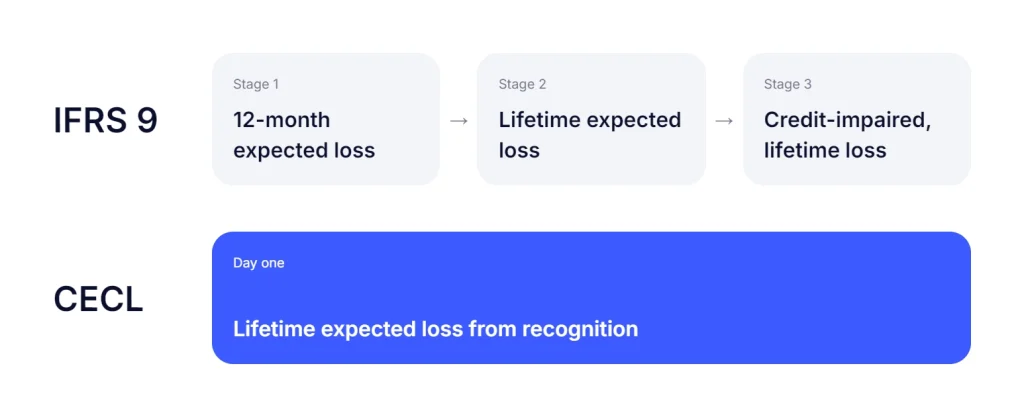
Both standards require organizations to recognize credit losses much earlier in the loan lifecycle and to base provisions on forward-looking information, including macroeconomic forecasts.
Under IFRS 9, a three-stage model starts at a twelve-month expected loss and moves to lifetime only after credit risk increases significantly. CECL requires a lifetime estimate from the day the loan is recognized, with no staging at all, so a newly originated portfolio takes a provision hit immediately. With earlier provisioning, expected losses reach the accounts before borrowers default.
A SICR assessment is the IFRS 9 trigger that moves a loan from Stage 1 (12-month expected loss) to Stage 2 (lifetime expected loss provisioning) once its credit quality has deteriorated materially. The assessment compares the risk of default today with the risk at the date the loan was first recognized, so the borrower’s current risk grade alone does not decide it.
A loan originated as high-risk does not sit in Stage 2 simply because it is high-risk. Monitoring systems track early warning indicators like minor payment delays or credit score drops to detect this movement promptly. Risk committees that catch these shifts early can adjust provisions and capital allocations before hard defaults hit the balance sheet.
Financial institutions run simulation models to test portfolio resilience against severe but plausible economic downturns. Stress tests evaluate how factors like surging unemployment rates, real estate crashes, or sharp interest rate hikes impact loan repayment behavior. Regular scenario analysis shows which underwriting tiers and origination cohorts are most exposed. Risk managers use these findings to refine lending criteria, rebalance exposure limits, and check that capital stays adequate.
For larger institutions in the US, EU, and UK, supervisors also run their own stress tests, and the results feed directly into capital requirements and distribution decisions.
Proactive credit risk monitoring after loan disbursement helps financial institutions identify early signs of repayment problems and respond before they develop into serious defaults.
Key strategies include:
Lenders use behavioral and financial signals to spot signs of borrower distress before a missed payment occurs. These can include sudden increases in revolving balances, frequent credit limit requests, or problems affecting the borrower’s industry or income. On commercial books, the equivalent signals are covenant headroom narrowing, delayed management accounts, and receivables aging faster than usual.
When lenders monitor these signals regularly, they can contact the borrower and act before the situation becomes more serious. An indicator set that fires across a large share of the portfolio produces alert fatigue instead of intervention. Calibrate triggers against how many cases the team can actually work through in a week.
When an account shows signs of increased risk, lenders can place it on a watchlist for closer monitoring. This may involve more frequent account reviews, tighter controls on credit increases, and a closer look at cash flow and collateral. The watchlist only works if entry and exit criteria are written down and someone owns each case. Otherwise, accounts pile up on it and nothing follows.
Credit limits should reflect a borrower’s current financial position rather than remain unchanged throughout the life of a loan.
Lenders can reduce or freeze available credit for higher-risk borrowers and increase limits for those with consistently strong performance. Regular reviews help keep lending exposure in line with the borrower’s changing circumstances and the lender’s risk tolerance. In the US, cutting a customer’s line on the basis of information in a consumer report can trigger adverse action notice obligations, so line management policy needs review from legal as well as risk.
Credit scoring models need regular validation to make sure they continue to separate lower- and higher-risk borrowers accurately as market conditions and borrower behavior change.
Here are the main metrics and validation methods risk teams use to assess model performance and stability.
Credit scoring models need regular validation to make sure they continue to separate lower- and higher-risk borrowers accurately as market conditions and borrower behavior change.
Here are the main metrics and validation methods risk teams use to assess model performance and stability.
The AUC-ROC curve measures a model’s overall capacity to differentiate between creditworthy borrowers and potential defaulters across all approval thresholds. Risk modelers convert this result into the Gini coefficient using Gini = 2 × AUC − 1, which rescales a 0.5-to-1.0 AUC range onto a 0-to-1 scale where zero is a coin flip.
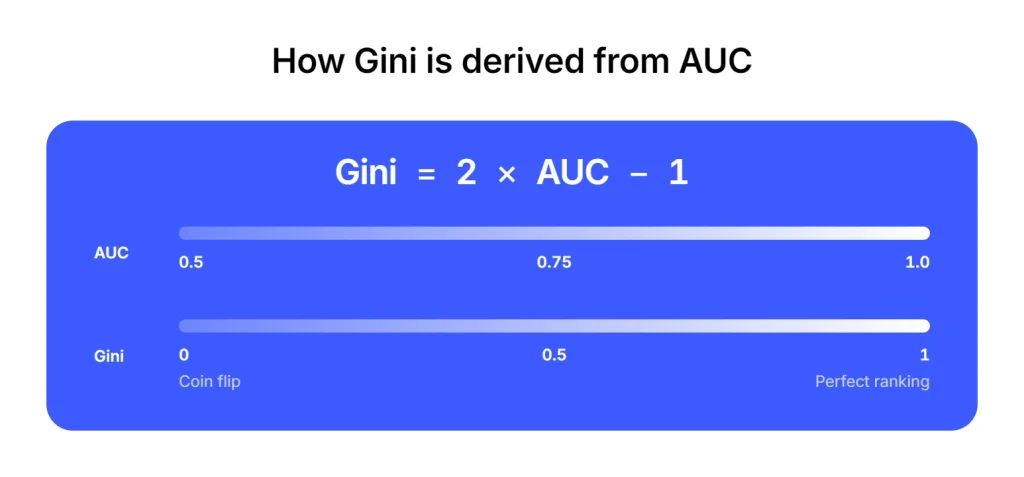
Higher values indicate that the model ranks risk reliably, and underwriting teams can set approval cut-offs with more confidence. What counts as a good score is portfolio-dependent, so a Gini is only meaningful against the same model’s development benchmark or a comparable population.
The KS statistic pinpoints the maximum gap between the cumulative distribution curves of defaulting and non-defaulting accounts. Analysts use this metric to evaluate how cleanly a scoring model segregates high-risk applicants from low-risk profiles within specific score bands.
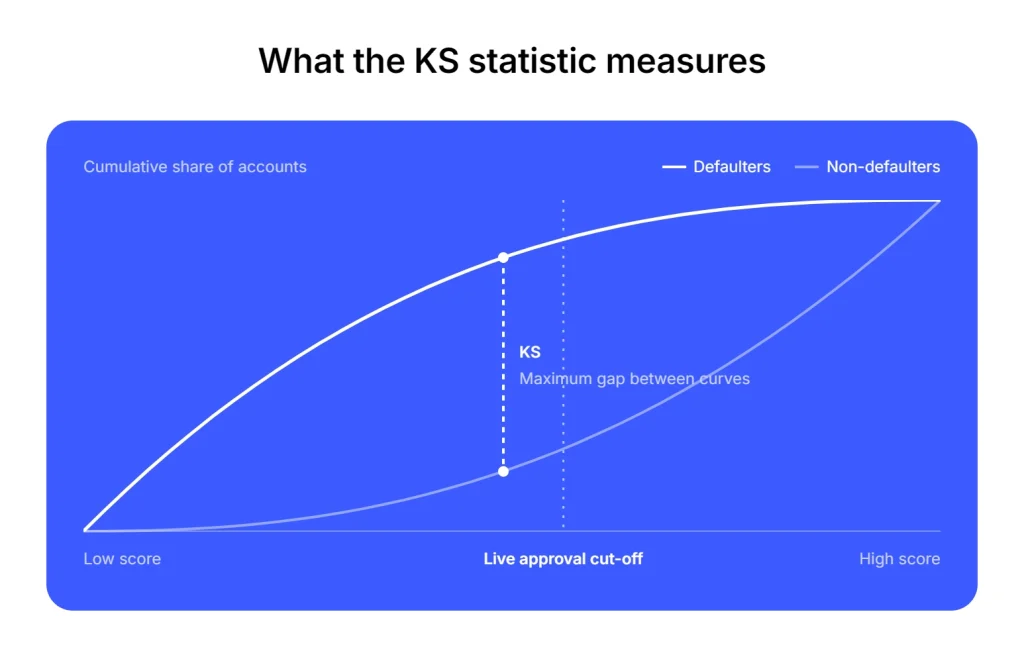
A high KS value means strong separation at some point in the score range. In practice, it matters only if that point lies close to the live approval cut-off.
PSI tracks shifts in borrower characteristics and score distributions between the initial development dataset and current applicant traffic. Monitoring this indicator alerts data teams when economic changes or new marketing channels alter incoming applicant profiles.
A rising PSI is an early sign that the model may drift, and it gives teams time to recalibrate scorecards before decision quality suffers. By convention, a value below 0.1 indicates a stable population, 0.1 to 0.25 a moderate shift that merits investigation, and above 0.25 a shift material enough to question whether the model still applies. These thresholds are industry rules of thumb, not regulatory limits, and some teams set their own.
Backtesting compares past model predictions directly against actual real-world loan performance over a set historical period. Credit analysts run these empirical checks to verify that forecasted default probabilities match observed default rates.
Regular validation exposes model bias and shows whether the model needs targeted updates. It should check two things separately: whether the model ranks borrowers in the right order (discrimination) and whether its PDs match observed default rates (calibration). A model can pass the first test and fail the second by assigning PDs that run systematically low. That error shows up in provisioning long before it shows up in approval quality.
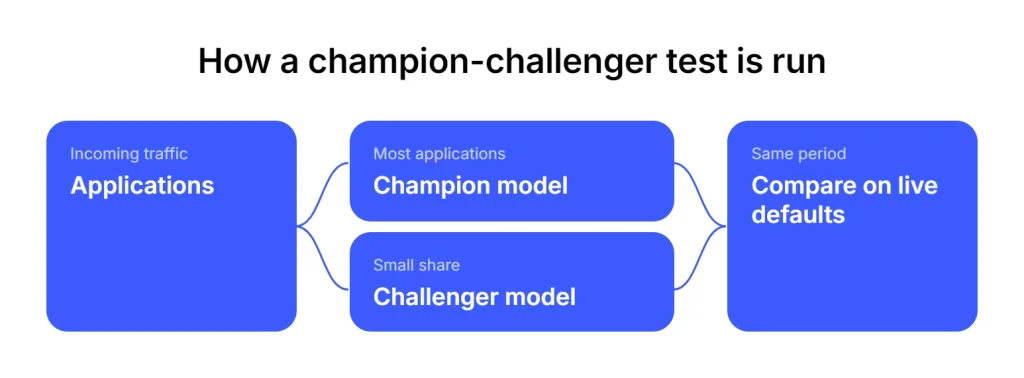
Champion-challenger frameworks test new credit models in live production by directing a small percentage of application traffic to an experimental strategy. Risk managers benchmark the challenger’s performance directly against the primary champion model using real-time applicant data. Because only a small share of applications goes through the new logic, the test limits operational risk. On longer-tenor products, a challenger needs enough seasoning for defaults to emerge before any comparison means anything.
Detecting a red-flag credit risk can be tricky. That’s why credit providers often employ a variety of credit risk management tools and procedures to ensure minimal risk to a business and maintain maximum profitability.
Below we’ve lain out some of the credit risk management techniques used and how they work. Each of them has its own unique advantages and disadvantages. Lending providers often engage a combination of these tools and utilize them for managing credit and lending risk. This combined approach offers the best chance to catch bad loans early and protect profitability.
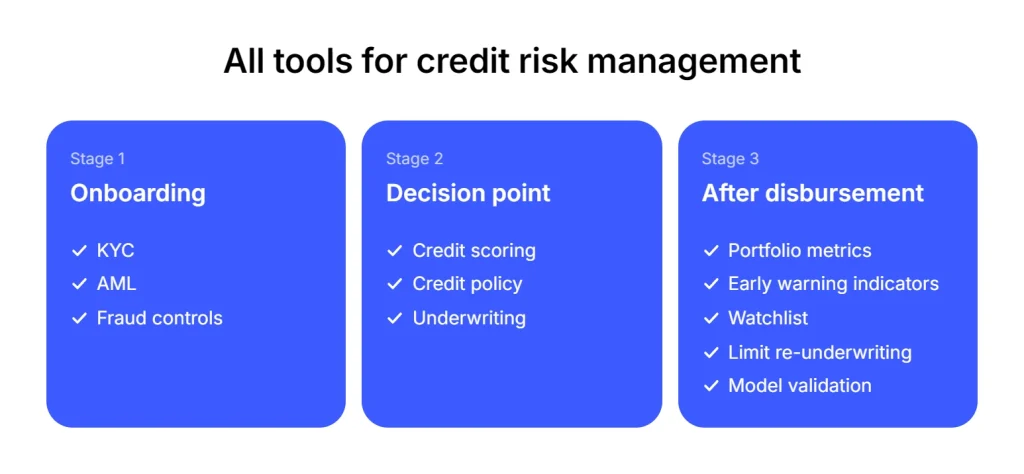
Know your customer (KYC) and anti-money laundering (AML) are financial crime controls, not credit risk measures, but they sit upstream of every credit decision. An unverified identity makes every downstream score meaningless. Some first-payment defaults are also fraud cases that no credit model would catch. Depending on local requirements, lenders may need to run one or both of these procedures. Identity verification usually means checking a client’s ID and proof of address data against a verification database.
Traditional credit scoring systems return a numeric value that a lender uses to decide whether to issue a loan. In the US, the score itself is produced by a model developer such as FICO or VantageScore, calculated on data held at Equifax, Experian, or TransUnion, one of the three consumer reporting agencies. The distinction matters when a decision has to be explained, because the score and the underlying data have different owners. Lenders that build their own scorecards on internal data use credit scoring software instead.
Although credit scores do give some indication of a person’s creditworthiness, they have also received criticism for not being inclusive. Federal Reserve analysis published in October 2025, drawing on CFPB data for 2020, puts roughly 32 million American adults outside the scoring system: about 7 million are “credit invisible” with no credit file at all, and around 25 million hold a “thin file” with too little recent activity to generate a score.
Credit risk doesn’t always come from one singular client. Instead, it might be a portfolio risk. By assessing the number of the micro (single loans) and macro (groups of loans), a company can detect risk or risky lending patterns that it may engage in. This helps the corporation to maintain a healthy debt-to-capital ratio and ensure competitively priced lending products.
Credit risk management platforms are where technology meets credit risk head-on. More and more lending providers are choosing to create such systems for assessing credit risk within their business. Often, they will work with a software provider or purchase a ready-made system to integrate into their overall business and use it to analyze risk. These systems may involve a variety of features designed specifically to the lender’s precise needs or more general software as well.
When comparing options, three questions usually matter more than the feature list: who owns the data, how much is configurable, and how much work it takes to change a policy after go-live. The answers decide how to measure credit risk consistently once volume grows.
Credit risk is dynamic, so historical payment behavior alone may not always provide an accurate picture of a borrower’s future ability to repay. To keep risk profiles up to date, financial institutions increasingly use artificial intelligence and machine learning to process large volumes of data for underwriting and monitoring.
The direction of travel shows up in survey data. In PwC’s European Credit Risk Survey 2026, banks named improving data integration and automation their most frequently selected strategic priority (26%), ahead of stronger credit monitoring and early warning capability (21%) and tighter origination and underwriting standards (13%).
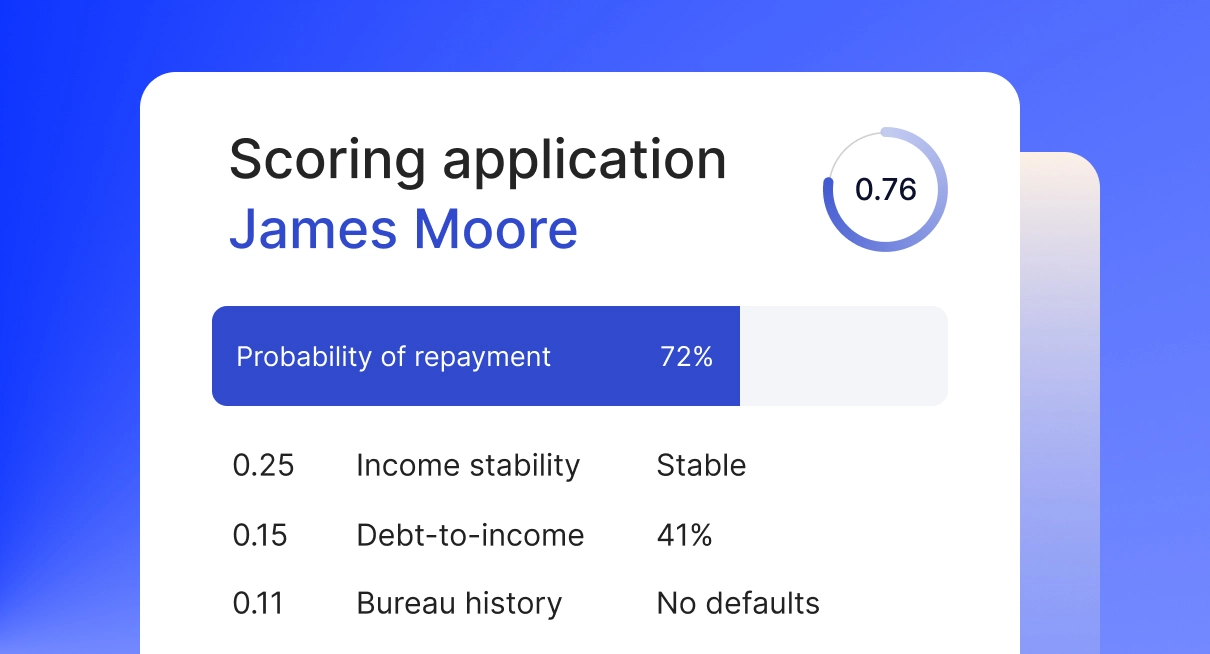
For a lender, a model is only useful if the credit team can read and explain its output. GiniMachine trains on a lender’s own historical loan and repayment data. For each application, it returns a probability of repayment, a resolution, and a per-attribute breakdown showing how each input contributed to the outcome. That breakdown gives a credit officer a readable basis for a decision, including a declined one, where a bare score gives none.
Each model build also comes with a validation report that includes the Gini index.
Each of these ways to manage credit risk covers a different stage of the loan: identity and fraud controls at onboarding, scoring at the decision point, and portfolio metrics and model validation after disbursement. None of them works on its own.
The eight practices below show how the credit risk measurement methods above apply to managing credit risk day to day and help portfolios hold up during a downturn.
Clear disclosure is a compliance obligation, and it also lowers credit risk. Borrowers who understand their rate, fee schedule, and payment dates dispute less, self-cure more often, and cost less to service when they do fall behind.
Ambiguous terms surface later as complaints, contested balances, and collections cases that are harder to resolve. All of them raise the real cost of a delinquent account well beyond the unpaid principal.
Relying on older tools leaves your business more vulnerable to credit risk. One of the key elements of effective credit risk management is constantly looking forward to the latest technologies. It means that you will be on the cutting-edge of credit trends and more easily able to adapt to a rapidly changing market.
Global financial disruptions such as the 2008 subprime mortgage crisis and the 2020 economic shock demonstrate how suddenly portfolio quality can decline. In periods like these, the delay between spotting a shift in the data and acting on it often costs more than any gap in analytics. Getting the right credit risk management tools is the first step.
Technology only performs within a defined operating structure. Four things need settling before deployment:
Sometimes this means training staff on new data entry rules; on larger implementations, it means reassigning approval authority and rewriting the credit policy around the system. Either way, the structure for calculating credit risk has to exist before the tooling does, or the tooling simply encodes whatever ambiguity was already there.
Executive leadership decides how much loss the business can absorb in a bad year and at what point growth should stop.
A detailed credit policy translates these high-level principles into daily underwriting rules, score cutoffs, and approval limits for frontline teams. Regular policy reviews keep lending activity matched with overall business goals as economic conditions change.
Setting these parameters early is one of those credit risk measurement techniques that help underwriters handle applications consistently without guessing how much risk is acceptable.
Too much exposure to a single industry, region, or borrower group can amplify losses when that segment faces a downturn.
To keep limits enforceable, separate hard limits that block new origination from soft limits that trigger escalation, name who can approve a breach, and report utilization against each limit on the same cycle as the rest of the portfolio. Portfolio diversification also reduces the impact of localized defaults on the portfolio as a whole.
Sound underwriting starts with assessing whether a borrower can realistically repay the loan. This means verifying income, reviewing existing debt, and assessing collateral where applicable.
Standard documentation and approval procedures reduce errors and cut unnecessary exceptions, which protects asset quality over the life of the loan. Exceptions should also be tracked as a separate metric. Broken down by underwriter and by product, with the performance of those loans measured separately, exception data often reveals policy drift before aggregate ratios do.
Predictive scorecards can lose accuracy over time as borrower behaviors change and financial habits evolve.
Risk analysts should run routine backtesting procedures to compare past credit score predictions against observed default rates. Tracking indicators like the Gini coefficient and PSI between backtests shows score decay before it affects approval decisions. Periodic updates to credit risk model rules also correct bias before it turns into unexpected defaults across active accounts. Fix the validation cadence in advance, and have someone other than the model’s developer run the review.
Traditional credit bureau data may not fully reflect the financial situation of borrowers with limited credit histories. Adding information such as rental payments, utility bills, and cash-flow data from open banking connections can give lenders a broader view of repayment capacity.
Used appropriately, these additional signals can help lenders reach new customer segments without weakening core underwriting standards or increasing portfolio risk. Before a new variable goes into production, it should improve separation on the lender’s own population, since a vendor’s benchmark is built on someone else’s borrowers. Its effect also has to be testable for disparate impact, because any attribute entering a lending decision can face fair lending review.
Effective credit risk management goes beyond assessing a borrower at the point of application. Lenders need a broader approach that combines reliable credit risk assessment, written risk policies, ongoing monitoring, model validation, and regulatory compliance to keep portfolios resilient as conditions change.
For most lenders, the binding constraint is interpretability. Data volume rarely is. A risk signal that cannot be explained to a credit committee, an auditor, or a declined applicant is difficult to act on.
GiniMachine builds, validates, and deploys credit risk models on a lender’s own loan history and returns the per-attribute contributions behind each score so decisions stay traceable.
Want to see how AI-powered risk assessment fits your credit risk management process?
Book a demo with the GiniMachine team.

