Lead Scoring at HES FinTech
GiniMachine assisted HES FinTech in enhancing their sales strategies by implementing lead scoring techniques
Challenge
HES FinTech’s marketing department was generating a significant volume of leads, which the sales department had to handle. This process involved extensive manual work, including searching for additional information, conducting demos, and calculating project costs. This not only consumed a lot of time and resources but also made it challenging to scale the hiring of such employees due to their cost and lengthy onboarding. The challenge was to focus the sales department’s attention on potentially high-value leads.
Approach
To address this challenge, HES FinTech needed a way to segment leads for both the sales and marketing departments. The goal was to direct highly-rated leads to the sales team while automating the handling of cold leads with marketing materials, including answers to frequently asked questions and product demos.
Historical data played a crucial role in this approach. HES FinTech had been aggregating lead data in HubSpot for three years, which was used to build the initial model. The data included various attributes such as
- lead source
- corporate or personal email
- business type
- active business status
- application date
- year of company establishment
- industry, employee count
- public company status
- annual revenue
- the latest referral
Result
After data preparation, HES FinTech achieved a Gini index of 0.6, indicating that the model could be used for commercial purposes. The target column for training was the lead’s action, whether it resulted in a deal or product license payment. This training led to the following outcomes:
- Median quality score of all leads was 0.25, serving as the baseline for lead quality assessment.
- Leads with scores above the threshold were assigned to sales, while those below were filtered out.
- Low-quality and non-targeted leads received low scores (0.02), enabling their removal from the sales funnel or immediate automated processing using CRM tools.
- MQL and SQL leads were immediately directed to the sales department, improving the conversion rate from MQL to Customer.
The daily process involves enriching data for leads in HubSpot, utilizing information gathered from form submissions on the website. These leads are then sent to GiniMachine through an API, which returns lead scores and records them in a designated field for lead distribution and reporting.
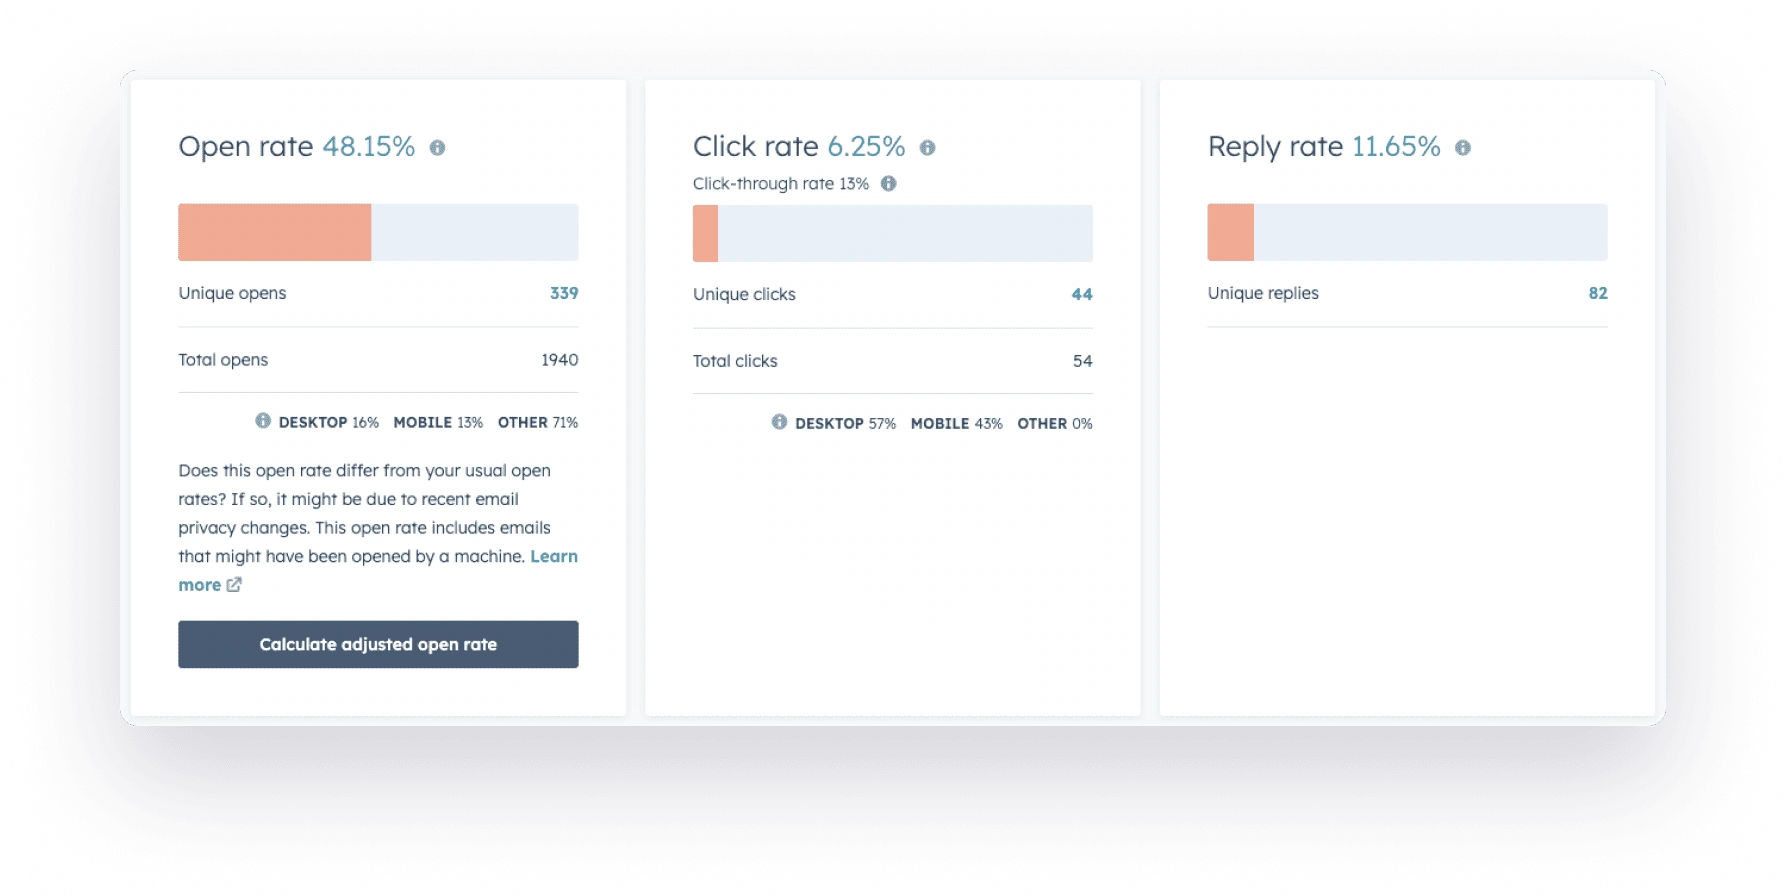
This scoring system has been highly effective, resulting in a 12% response rate for low-quality leads that are re-engaged through email campaigns.
We spend less time qualifying leads in CRM, allowing us to allocate more time to pre-sales activities. Lead quality has significantly improved, and the average deal size has increased. GiniMachine’s lead scoring has streamlined our lead qualification process.
Artem Britun,
Head of Sales at HES FinTech
 Artem Britun,
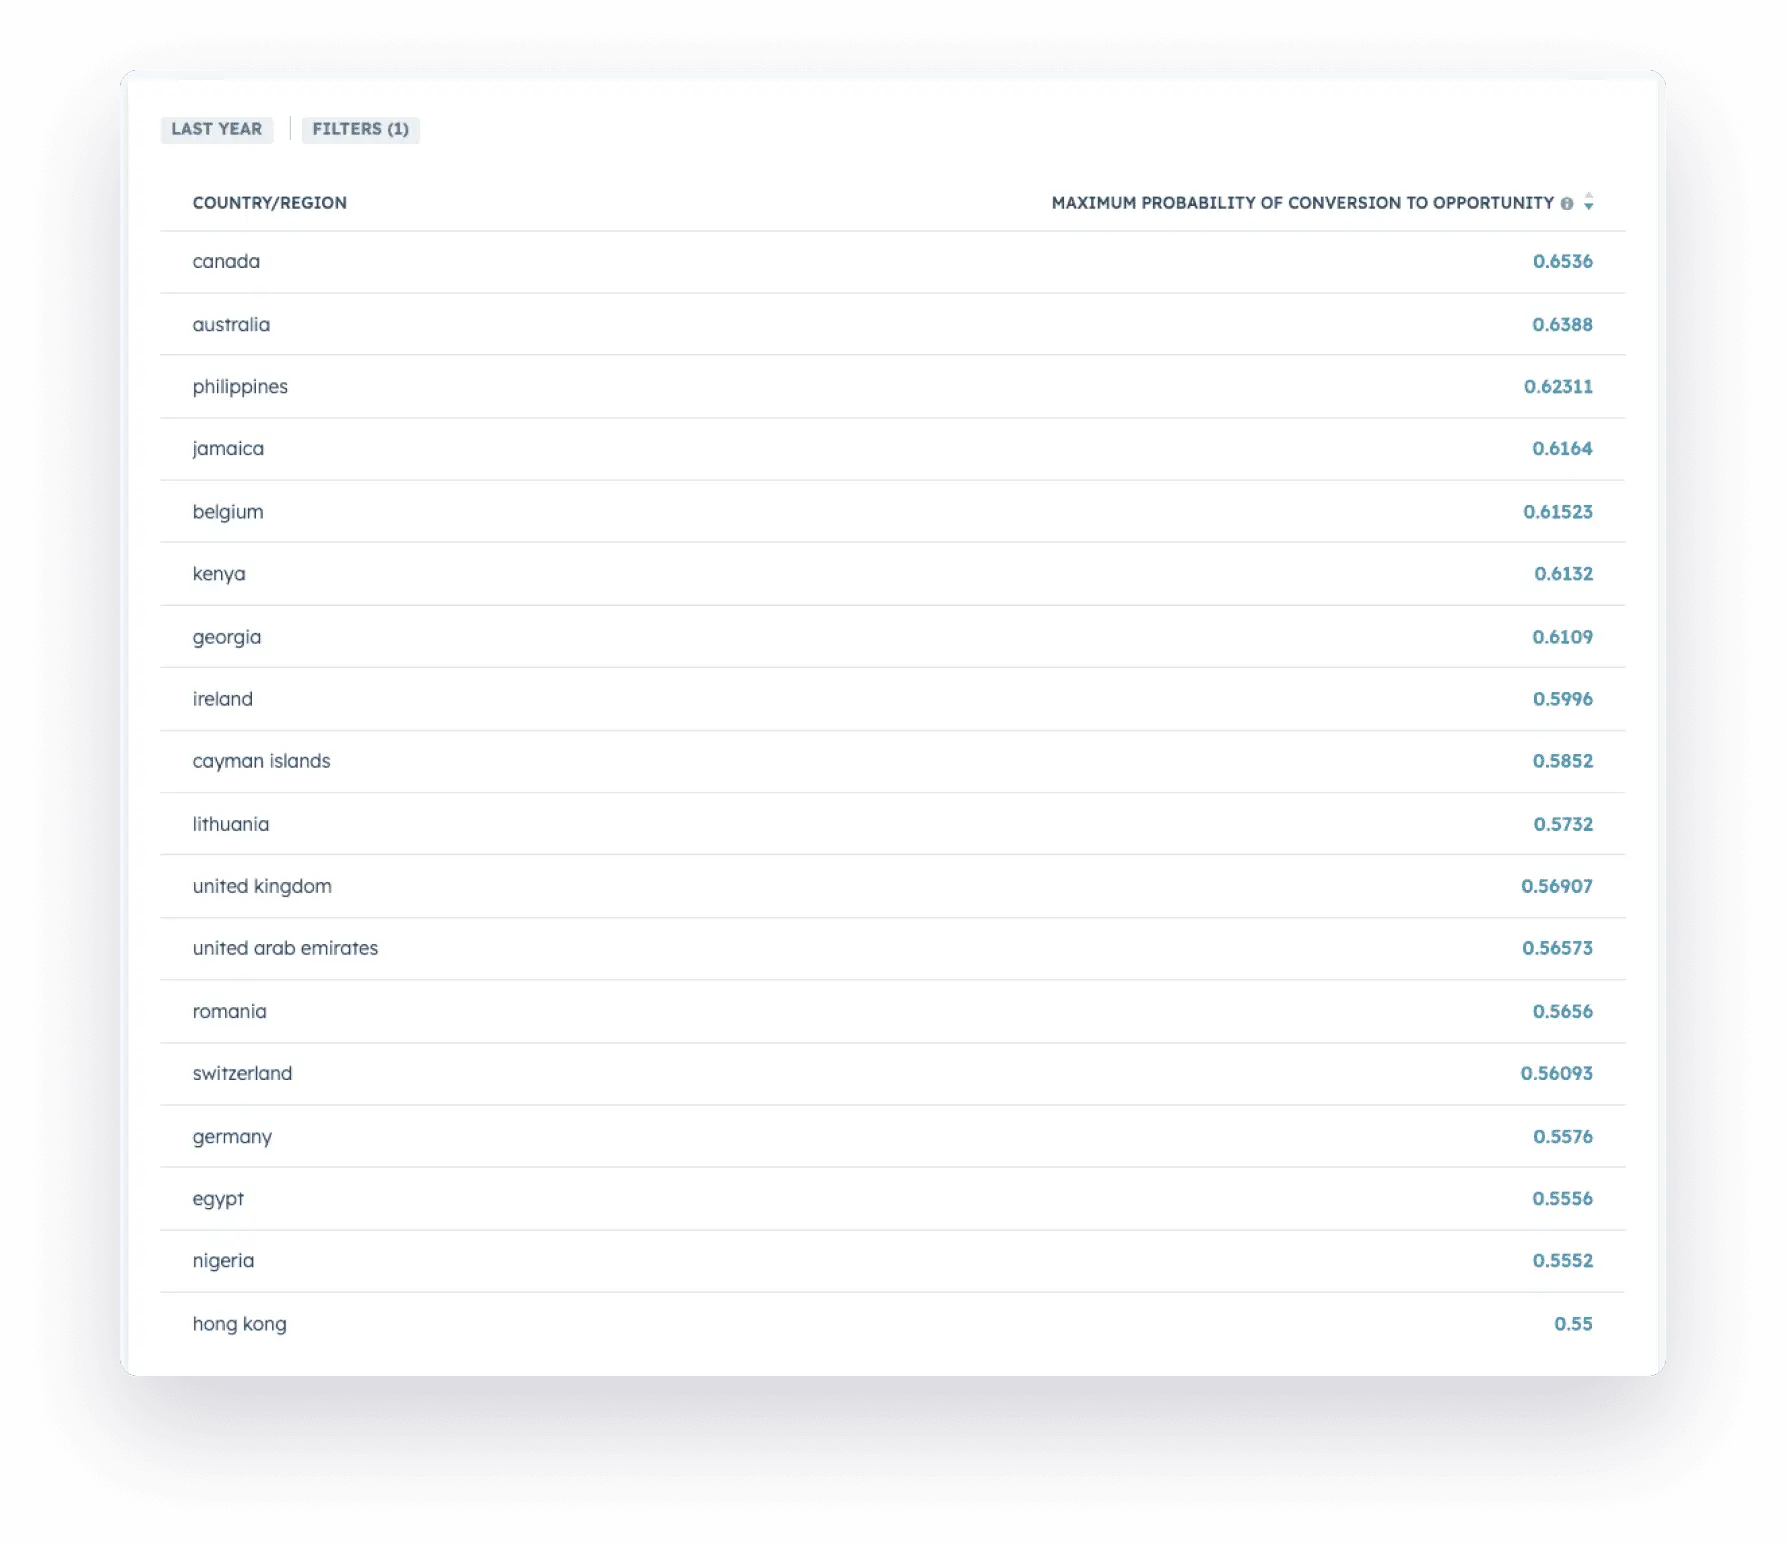
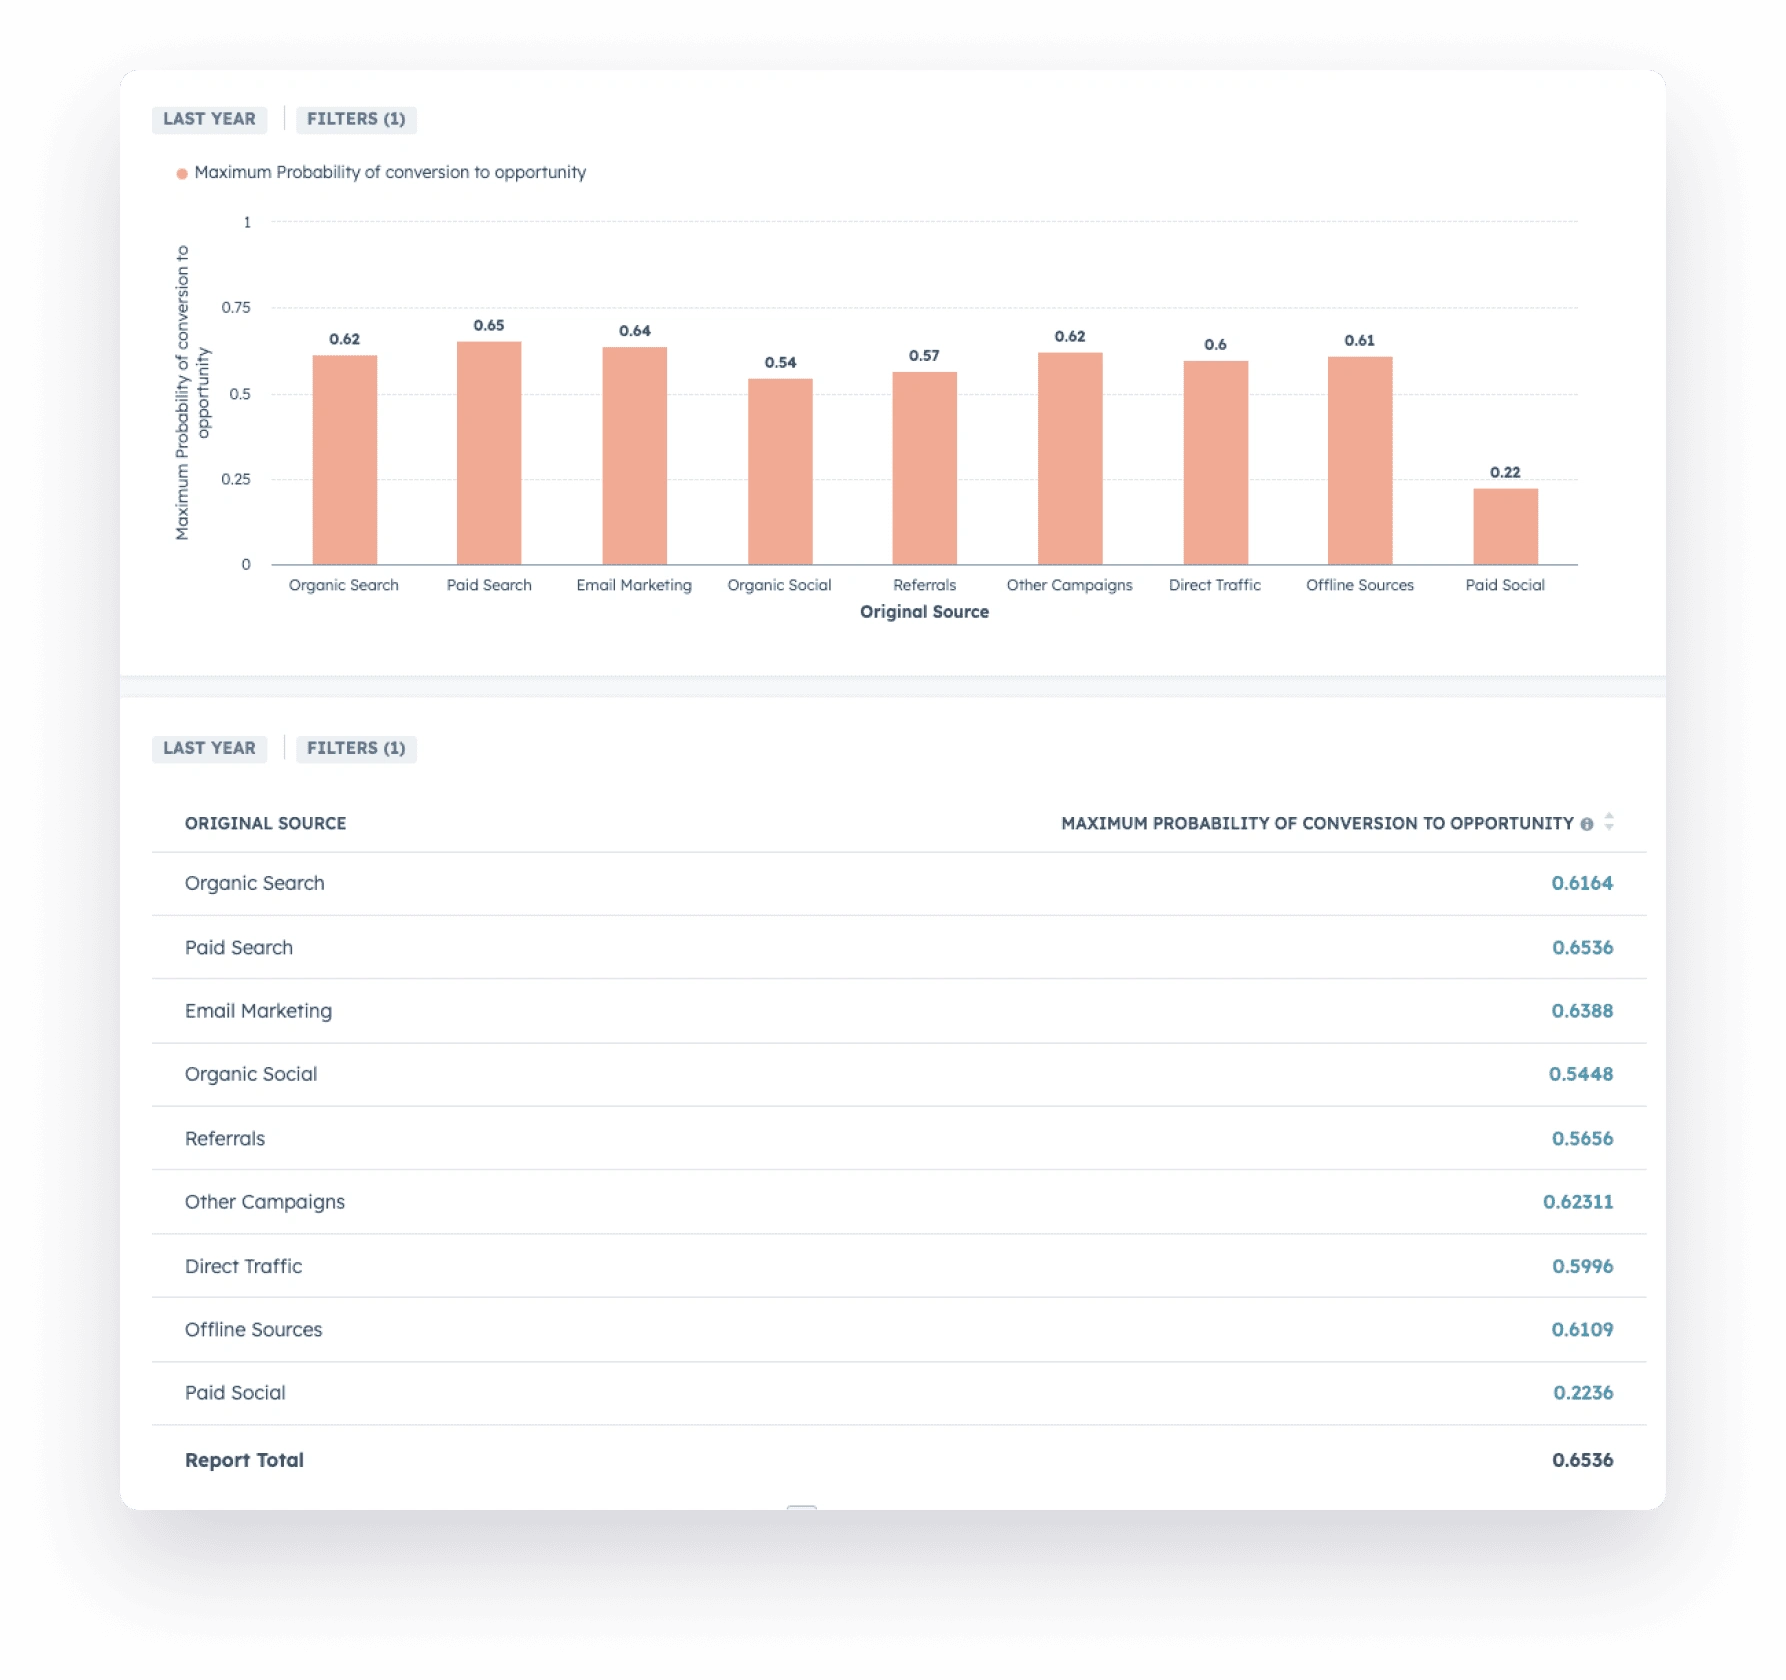
 GiniMachine’s lead scoring has provided valuable insights and empowered us to generate reports without waiting for inputs from other departments. For instance, we can now analyze how specific regions, channels, and business types perform and adjust our campaigns accordingly. Our experience will benefit companies with high lead volumes and limited resources for lead management, making it particularly suitable for the e-commerce industry.
Head of Marketing at HES FinTech
 Yury Sigay,
 Conclusion
Implementing GiniMachine for lead scoring at HES FinTech has brought several benefits:
- Effective segmentation of leads into high-quality and lower-quality categories.
- Resource optimization for the sales department.
- Focused attention on more valuable leads by the sales team.
- Enhanced reporting capabilities for the marketing department.
This successful case study demonstrates the power of lead scoring using GiniMachine, particularly for companies dealing with a high volume of leads and limited resources.
Lead Scoring Model Performance Evaluation
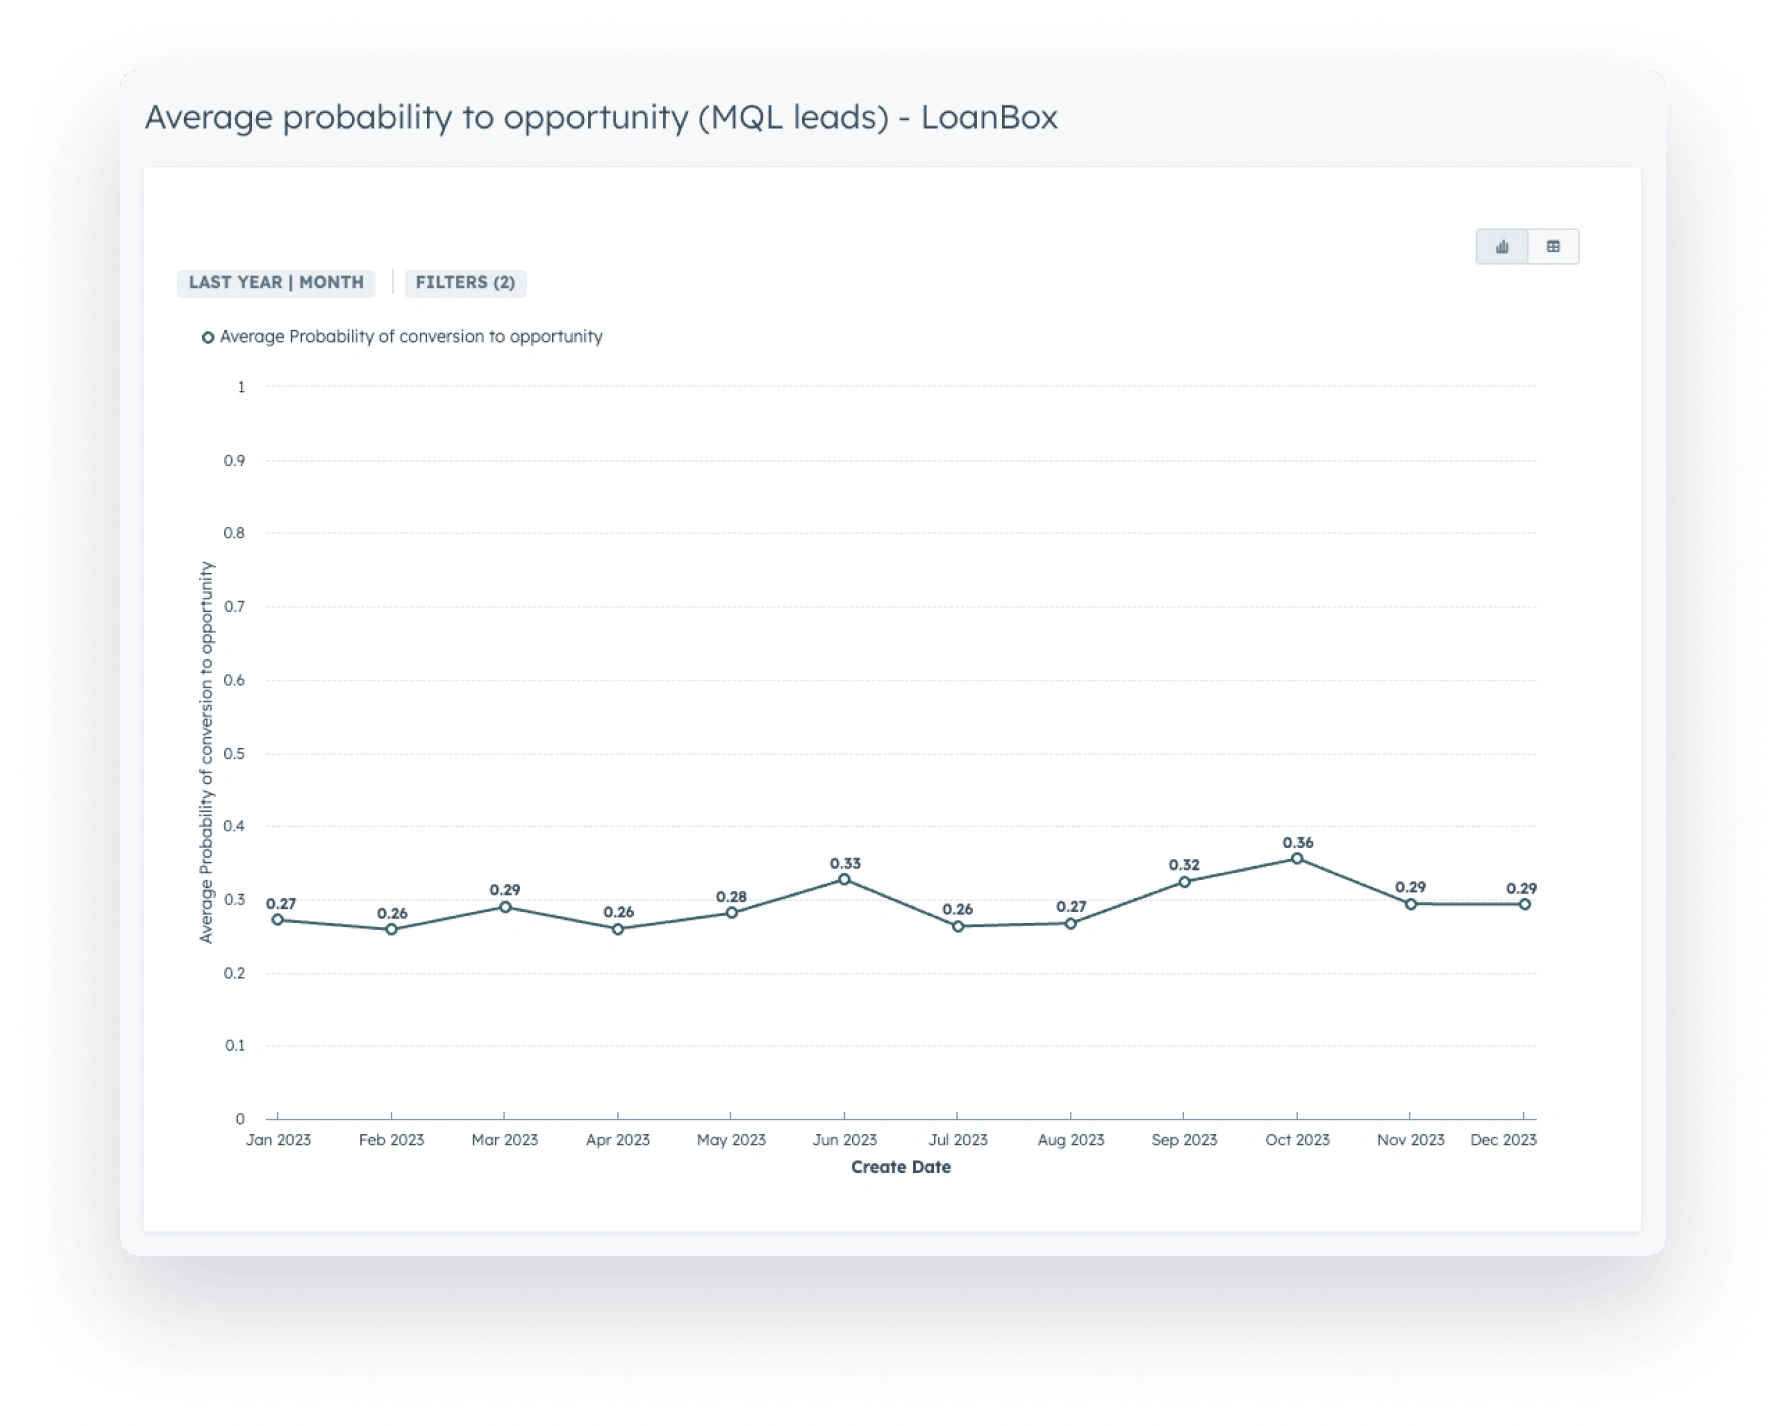
In this evaluation, we will assess the performance of the lead scoring model used at HES FinTech. The model was trained on opportunities due to the limited number of actual customers. The average lead quality for the past month is 0.29.
Hypotheses for Examination
Hypothesis 1 – Low-quality leads should receive low scores
Hypothesis 2 – There should be a funnel-shaped trend towards an increase when transitioning between different deal lifecycle stages
Hypothesis 1 – Low-Quality Leads vs. Lead Score
To test the first theory that low-quality leads should receive low scores, manual sourcing of unqualified leads revealed that Unqualified leads had scores ranging from 0.0008 to 0.64.
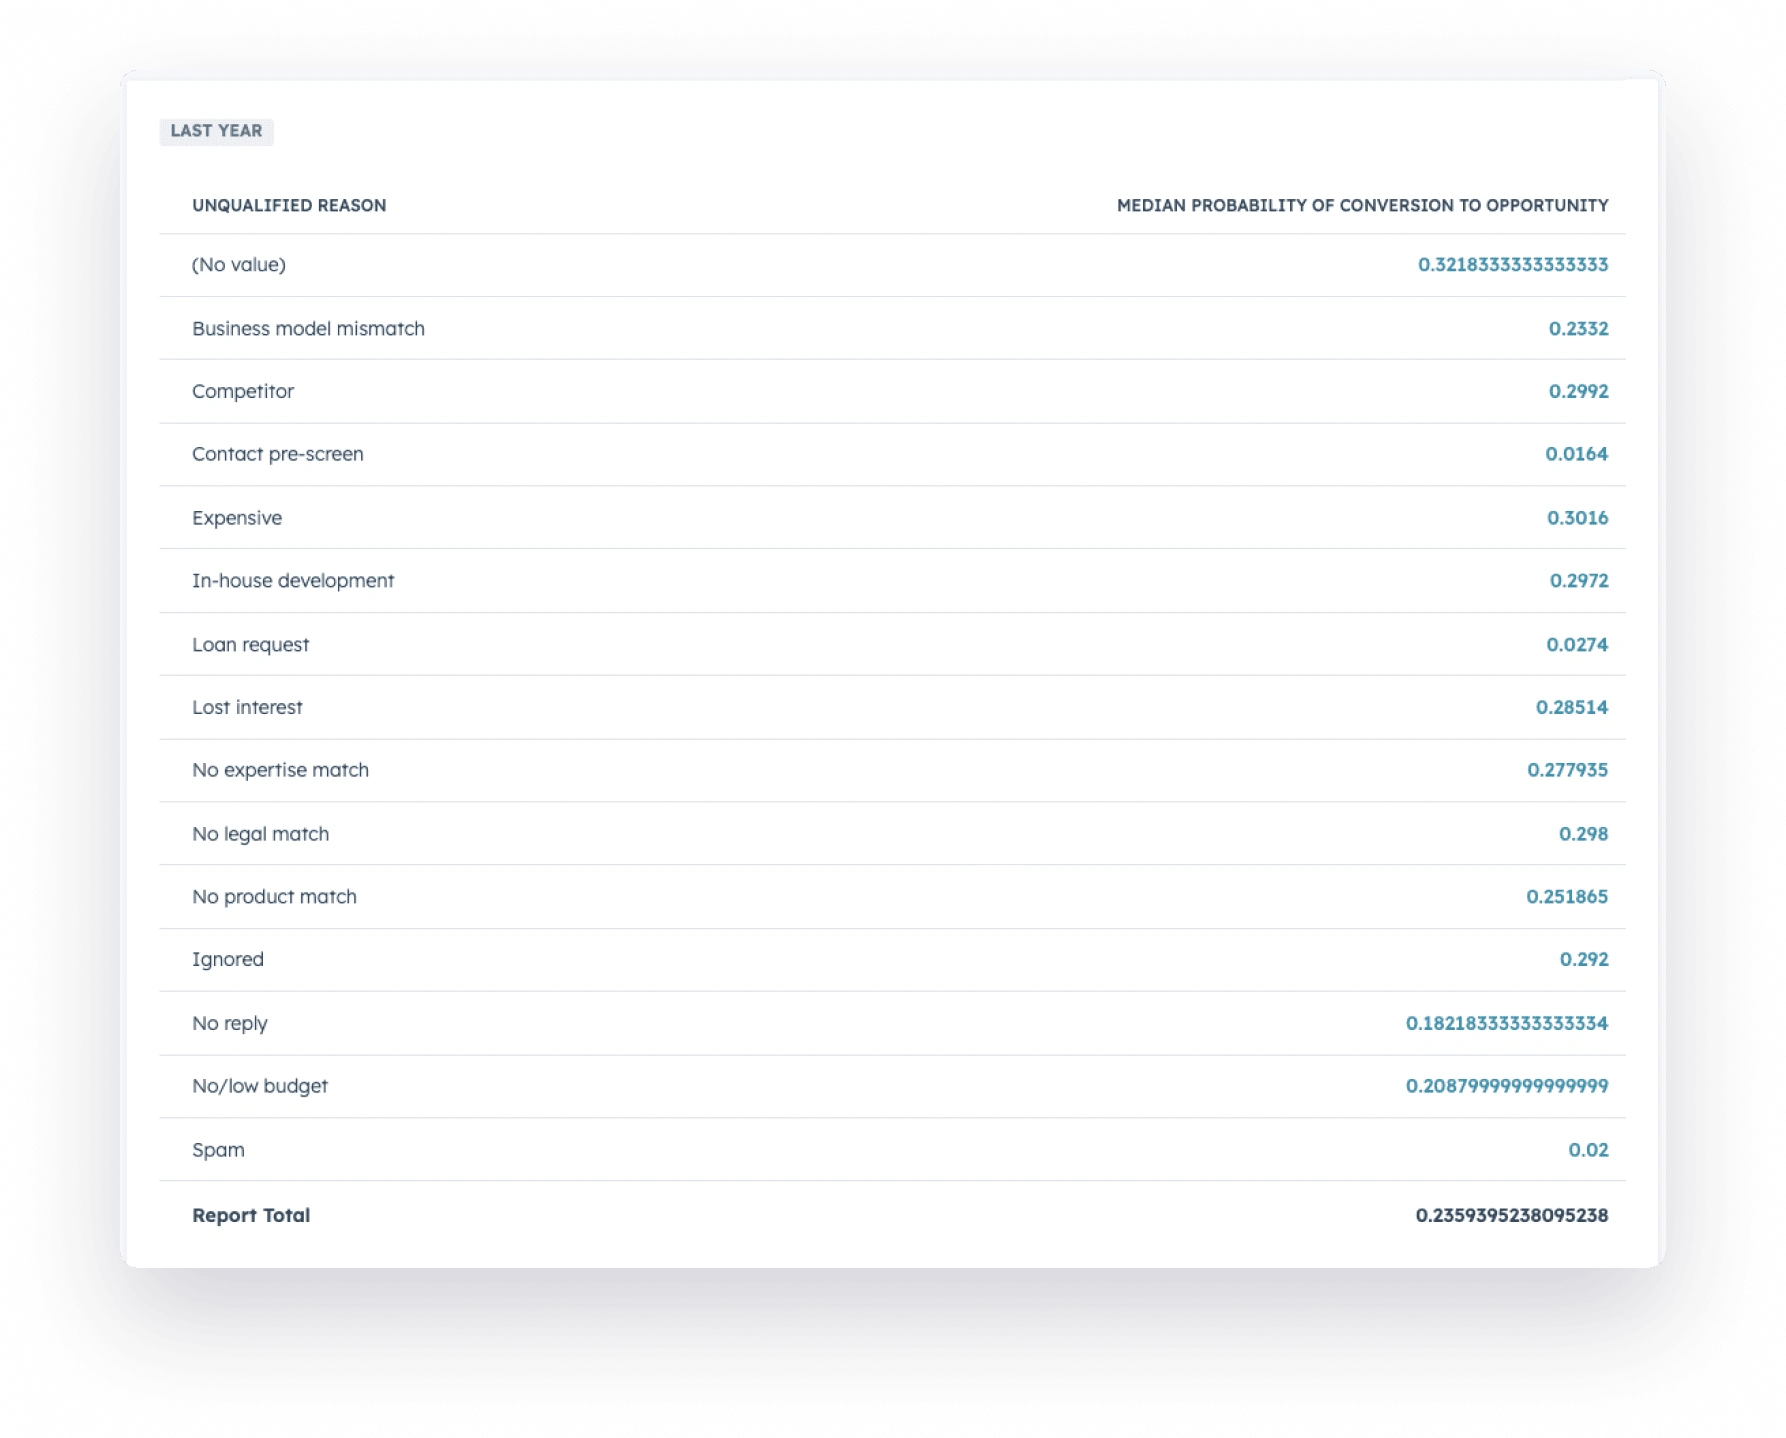
Median values for various unqualified reasons are as follows.
Unqualified reason
| Spam | 0.02 |
| Loan request | 0.2 |
| No reply | 0.18 |
| Ignored | 0.2 |
Conclusion
There is a correlation between lead quality and lead score. Leads with lower scores than the median value of 0.25 tend to be of lower quality. However, blindly trusting the score may result in a low-quality lead with a high score (e.g., 0.64), which should be disqualified.
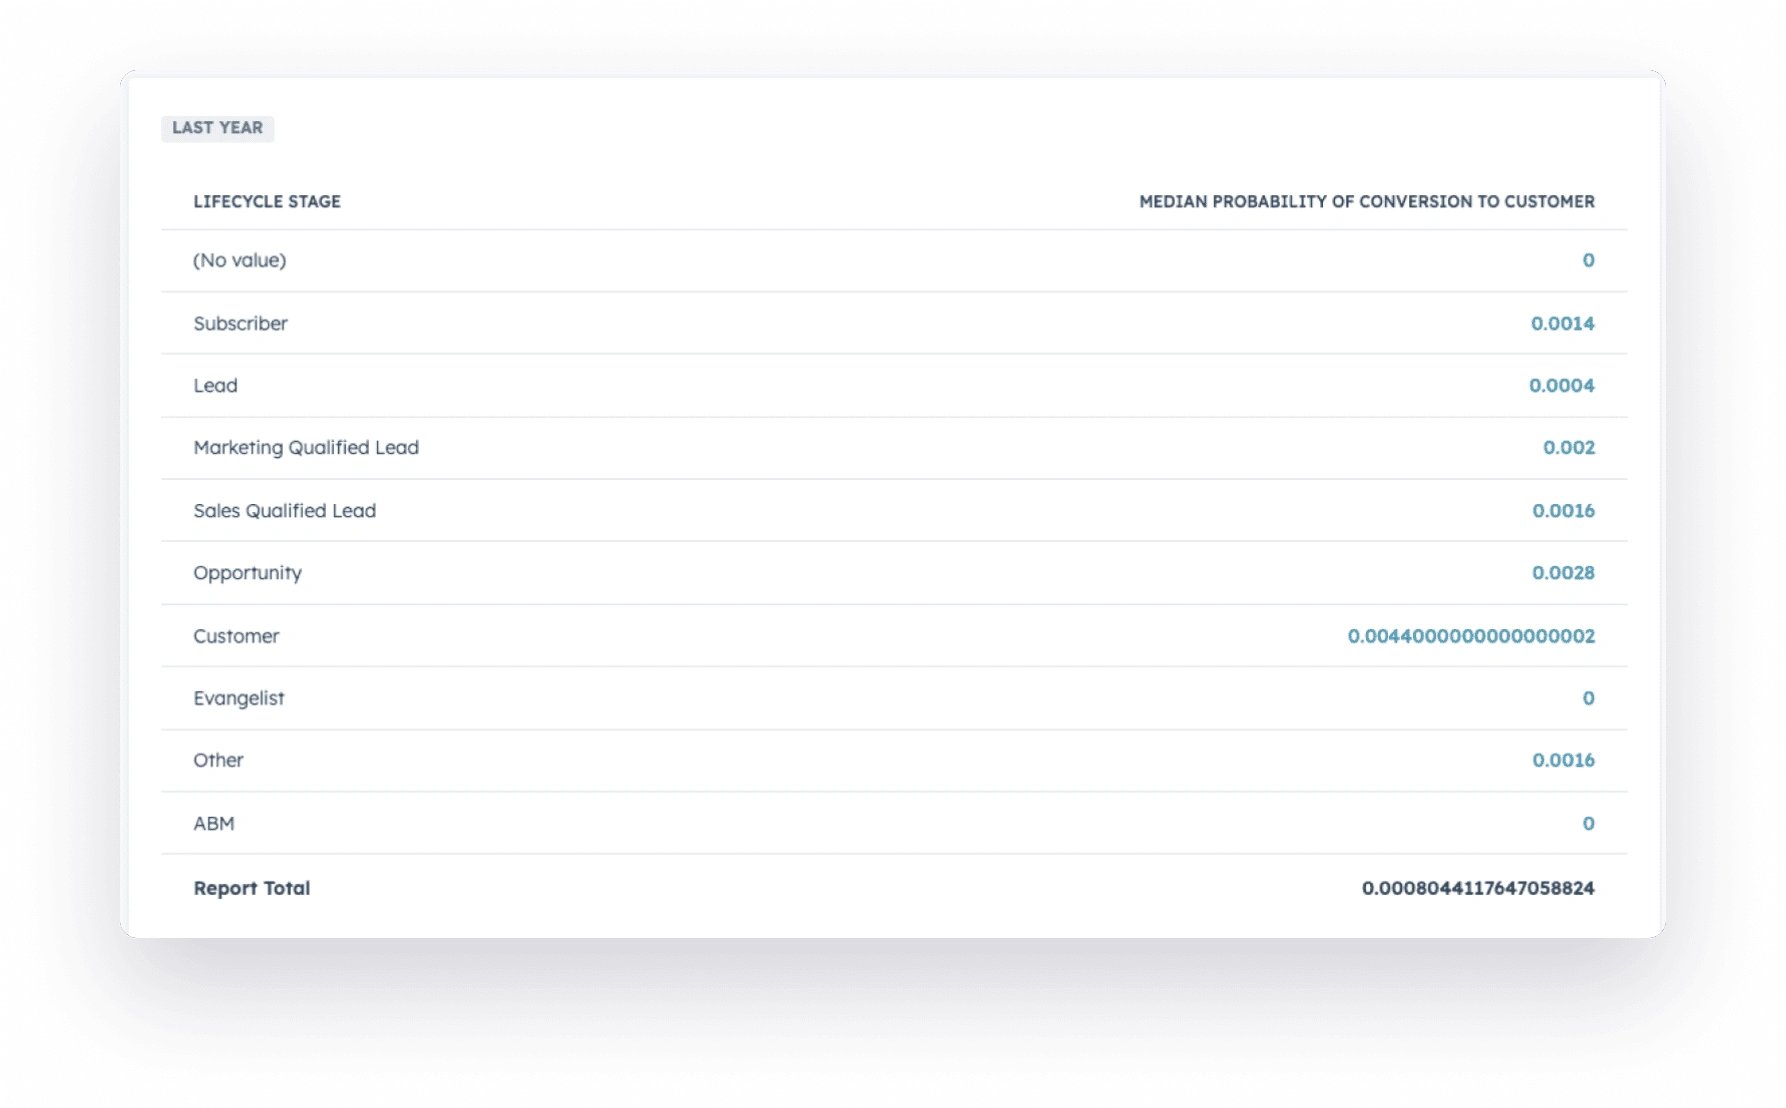
Hypothesis 2 – Lead Stage vs. Lead Score
To test the second theory that lead scores should increase as leads progress through different stages, we examined lead stages using probability to opportunities and probability to customers.
Manual Lead Handling and Verification
The minimum score ranges from 0.013 to a maximum of 0.65.
Lead scores for those who progressed to a deal:
- 0.26
- 0.41
- 0.25
- 0.17
- No score available
- 0.24
Conclusion
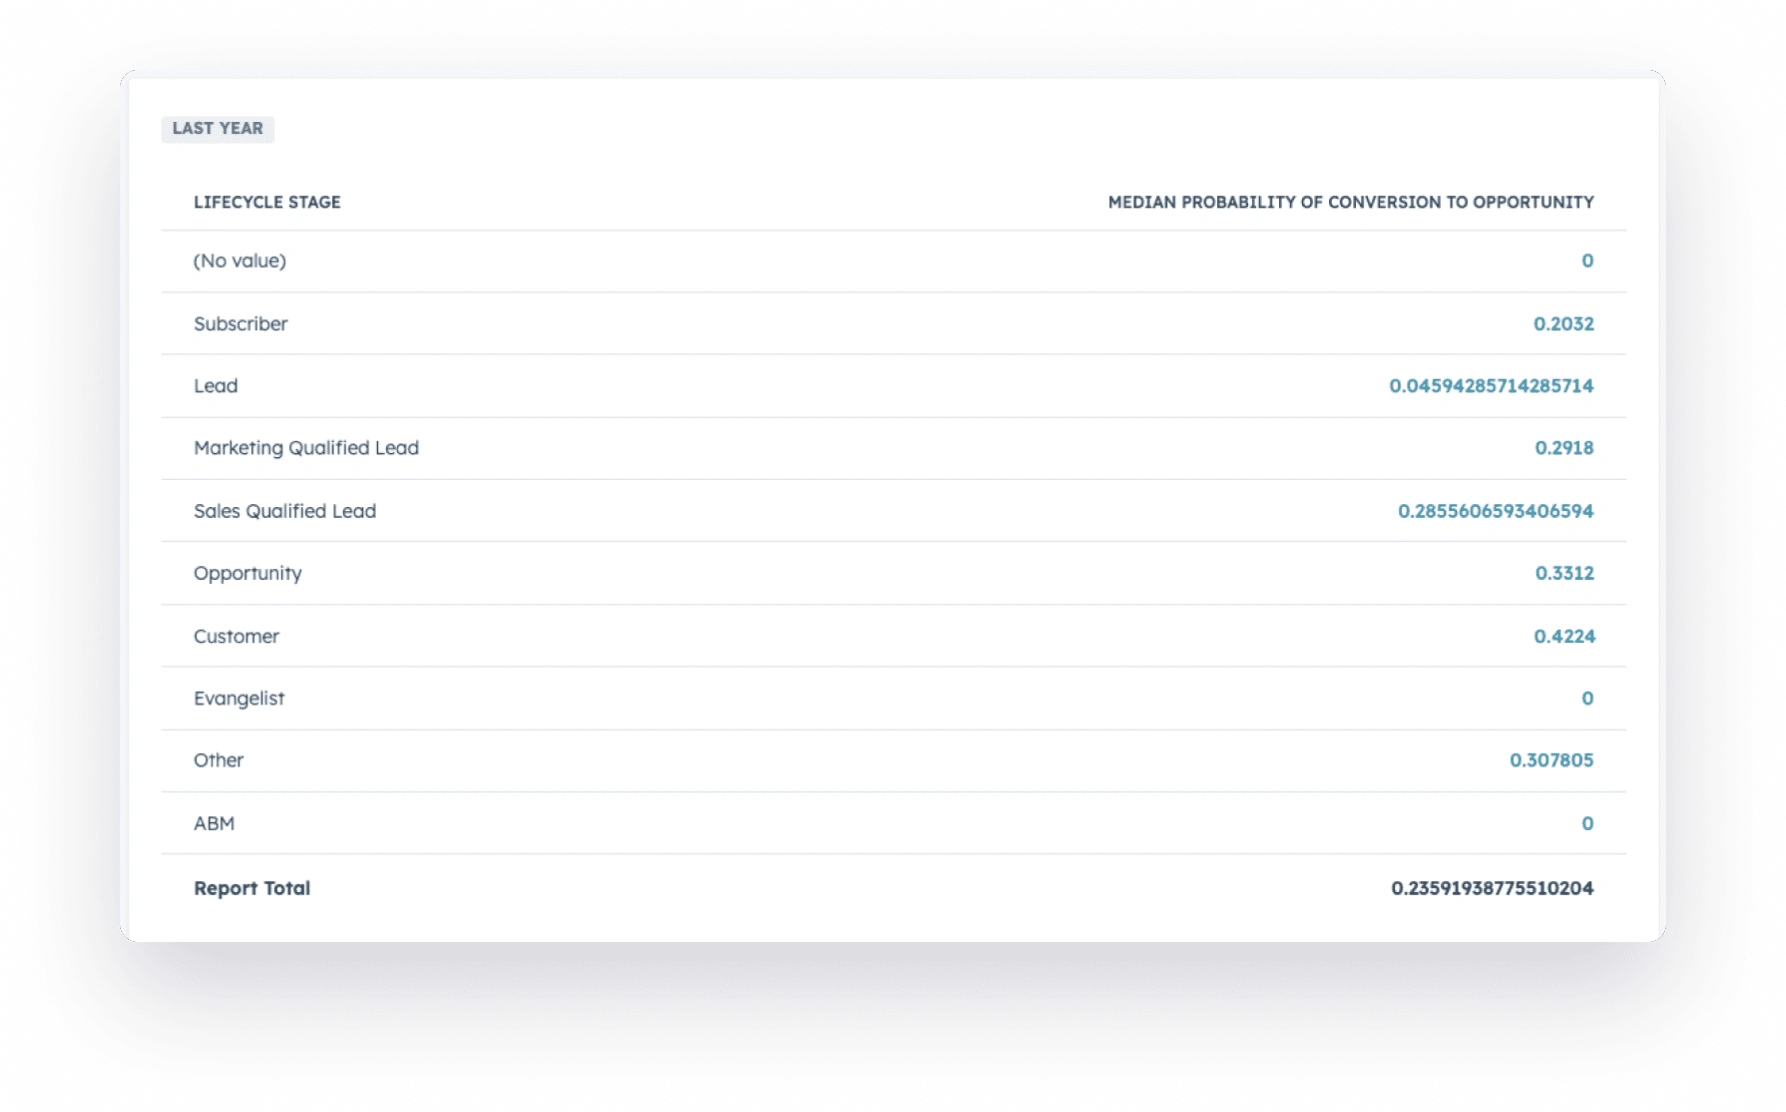
There is a correlation between lead quality and lead stage. Leads in the “Leads” stage tend to have the lowest scores, while the final “Customers” stage tends to have the highest scores. However, it is worth noting that lead quality in the “Customers” stage is lower than in the “Opportunities” stage, which may indicate a data issue.
Additional Insights
- When examining specific deals, it is evident that lead quality varies, but in many cases, it is above average.
- Lead scoring appears to improve as leads progress through stages, but decisions based solely on scores may not always be accurate.
- Further analysis indicates that minimum lead scores vary by stage, with “Customers” having the highest minimum score.
Lead verification based on minimum and maximum values by stage:
- MQL: Minimum from 0.0032 to 0.62
- SQL: Minimum from 0.001 to 0.63
- Opportunities: Minimum from 0.013 to 0.65
- Customers: Minimum from 0.013 to 0.66
Overall Conclusion
The lead scoring model at HES FinTech demonstrates a correlation between lead quality and lead score. Leads tend to have lower scores in earlier stages and higher scores as they progress. However, it is essential to consider other factors and not rely solely on lead scores for decision-making. Additionally, there may be data issues affecting lead quality in the “Customers” stage. This evaluation provides valuable insights for optimizing lead management strategies.
Other cases