
GiniMachine has long supported responsible AI in credit decisioning with PD calibration, model explainability (both at the model and individual-loan level), and ongoing model monitoring over time.
To further enhance our approach, we have equipped the GiniMachine platform with a dedicated fairness analysis for sensitive attributes.
Why Fairness Analysis Is Critical for Lenders
With the development of big data-driven AI/ML models, anti-bias and fairness topics attract growing attention from supervisors around the globe, being formalized in new regulatory requirements (e.g., the EU AI Act). Not monitoring disparate outcomes can translate into regulatory risk, reputational, and financial damage for businesses.
However, fairness analysis and anti-bias metrics have an even broader impact for business by uncovering business opportunities in the underserved segments with high repayment potential, like owners of micro-businesses, customers with a thin portfolio file, or customers from minority backgrounds.
How Fairness Analysis Works in GiniMachine
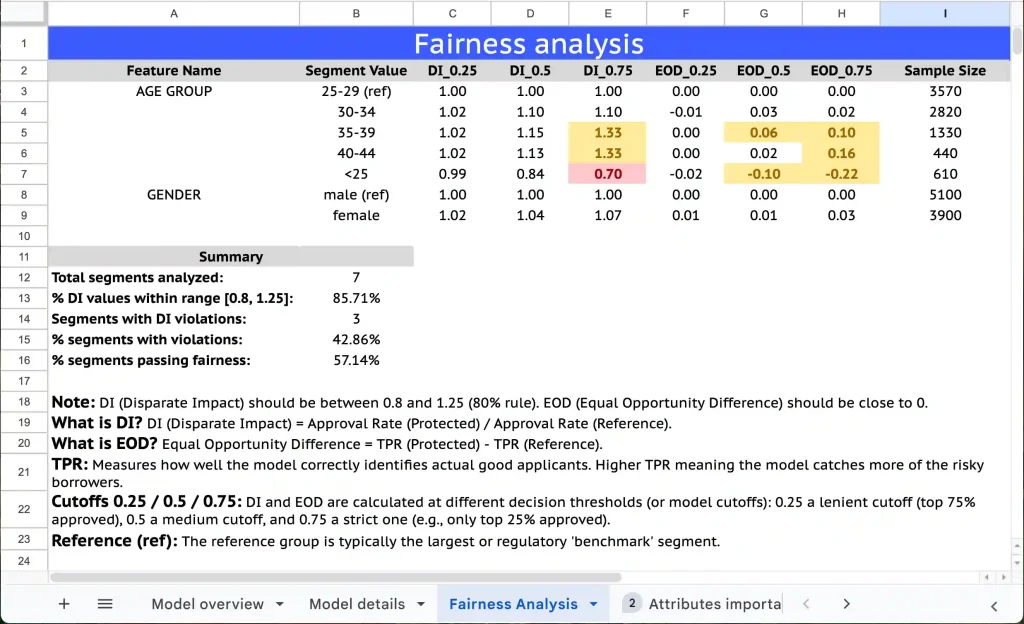
In credit scoring, sensitive attributes commonly include age, sex/gender, race/ethnicity, nationality, religion/belief, marital or family status, disability or health status, pregnancy or maternity, sexual orientation, and sometimes place of residence/postcode (as a proxy for socio-economic or ethnic bias). While you may not use all of them directly in your models, monitoring them is important to identify potential indirect bias.
For each selected sensitive feature, GiniMachine:
- sets a reference group (e.g. “25–34”, “MALE” or the largest / benchmark segment that policy or regulation treats as the “privileged” group)
- calculates Disparate Impact (DI)—the approval rate of each segment compared to the reference group
- calculates Equal Opportunity Difference (EOD)—how often truly good borrowers in each segment are approved compared to the reference group
- evaluates both metrics at three decision thresholds (0.25, 0.5, 0.75) to see how fairness behaves under lenient, medium and strict cut-offs
- highlights segments that fall outside the 80% rule for DI (0.8–1.25), or show noticeable EOD gaps.
Intuitively, DI shows whether approval rates are broadly similar across segments compared with the chosen reference group.
EOD shows whether truly good borrowers in each segment are over- or under-approved relative to that group. Looking at both together tells you not only if groups receive comparable approval outcomes overall, but also whether the model’s mistakes (missing good borrowers or favouring them unevenly) are concentrated in certain segments—giving you a clearer and more practical view of fairness in your credit decisions.
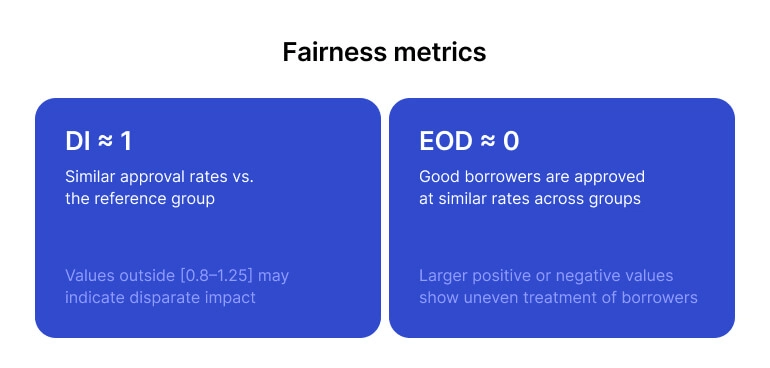
– DI ≈ 1 → similar approval rates vs. the reference group; values outside [0.8–1.25] may indicate disparate impact.
– EOD ≈ 0 → good borrowers are approved at similar rates across groups; larger positive or negative values show uneven treatment of good borrowers.
Why Is This Update Important
Together, DI and EOD help lenders see both who gets approved and who is correctly approved in each segment.
Such early visibility enables teams to address issues before they escalate, provide regulators and partners with solid evidence of responsible AI practices, and develop lending strategies that strike a balance between compliance, risk control, and long-term profitability.
Tatyana Kovalenko,
Head of R&D at GiniMachine
 Tatyana Kovalenko,
